
Eliminating the Paper Trail: Consumers Prefer to Use Cash For More Painful Purchases
Update: This work eventually turned into a published paper here.
The Idea
Imagine that you are making a relatively painful or guilt-inducing purchase such as overpaying for a slice of pizza at an airport or paying off a fine for a parking ticket. When the cashier requests payment, you reach into your wallet and decide whether to pay with either cash or a debit/credit card. Which payment method would you rather use?

Although past consumer research has generally found that paying with cash can be more painful than paying with cards in the moment (e.g., Soman 2001; Raghubir and Srivastava 2008; Shah et al. 2015), I have always found myself opting to use cash on purchases that I already feel the most bad about. Why? When I spend with a card, I know I’m going to be reminded of that purchase again - either when I check my bank or credit card statement or if I log in to a budgeting application like Mint.com. Using a card will increase my “paper trail” of the transaction and potentially cause me to feel the same purchase pain I’m feeling now again at a later date. When I use cash, while the cash will be gone from my wallet, there will be no record of the purchase - I’ll never have to risk thinking about it again.

In this project, I sought to discover whether my odd behavior is specific to me or a general consumer response to making painful purchases. Controlling for all other factors, are consumers more likely to use cash when the purchase they’re making is more painful?
Study: Analyzing Transaction Data from the Stanford University Bookstore
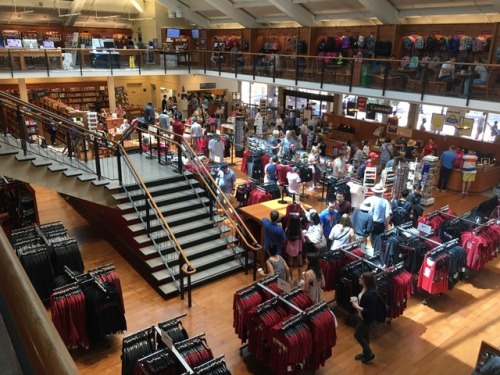
I was able to acquire a subset of transaction data from the Stanford University Bookstore that included information regarding every item purchased in-store from April 1, 2017 to May 13, 2017. Considering the wide variety of items that university bookstores sell (e.g., books, supplies, apparell, souvenirs, etc.), this is a great dataset for beginning to address the question of whether more painful purchases are more likely to be made with cash than cards.
Data Information
I cleaned and manipulated the data in a number of ways. First, I removed any items purchased that were described as either county bag fees, bottle deposits, or gift card purchases. Second, I filtered the data to include only purchases that were made with either cash or a debit or credit card. This removed less than 4% of the overall purchased items including any purchases made with a campus card or gift card. While campus (student points) and gift cards are certainly examples of cards, they are also purchase mechanisms that may greatly alleviate painful purchases and are outside the scope of this project.
| Payment Type | N | Freq |
|---|---|---|
| Campus Card | 4,067 | 3.18% |
| Cash | 24,625 | 19.24% |
| Check | 54 | 0.04% |
| Credit Card | 95,995 | 75.02% |
| Debit Card | 2,320 | 1.81% |
| Gift Card | 901 | 0.7% |
Finally, in addition to knowing information about a given purchased item, I also wanted to have information about the overall transaction that the item was apart of. To accomplish this, I assumed that items purchased on the same day, with the same transaction ID, at the same register, with the same cashier, and with the same payment type were all part of a single transaction. I calculated some overall statistics related to the number of items in each transaction, the cost of each transaction, and the discounts in each transacton, and augmented the item data with these aggregates.
Overall, the dataset included 122,940 items purchased. For each item purchased, the data included information on the following features:
date: The day in which the item was purchased.ID: A unique identifier for the transaction.register: The cash register where the purchase took place.cashier: The person who accepted the purchase.payment_type: The type of payment mechanism used.price_unit: The original price of the item.disc_unit: The amount discounted off the price of the item.paid_unit: The amount paid for the item.disc_dum_unit: A dummy variable for whether there was (= 1) or was not (= 0) a discount for the item.disc_pct_unit: The discount percent off the original price.items_total: The number of total items in the overall transaction.price_total: The total original price of the overall transaction.disc_total: The total amount discountd off the price of the overall transaction.disc_num_total: The number of items purchased on discount in the overall transaction.disc_pct_total: The discount percent off the overall transaction.Cash: A dummy variable for whether the entire transaction was paid for with cash (= 1) or card (= 0).item_description: A description of the purchased item.
Purchase Category
Outside of whether an item was purchased on discount, the resulting data provided very little information on how painful or guilt-inducing each purchase was. While the cost of the item is certainly related to pain, it also is extremely correlated with a lower propensity to pay with cash simply because people rarely carry a lot of cash with them. My objective was to find a good proxy for how painful it would feel to purchase an item while controlling for the cost of the item (and the overall transaction) to avoid this clear confound.
To accomplish this, I decided to crowdsource the level of pain and guilt people expected to feel when purchasing a given item and augment the data with these perceptions. Unfortunately, the only feature that identified each item was the item_description and this feature was often either hard to decipher from the store identifer (which I did not receive a key for) or too specific for the general public to be aware of.
| Item Description | N | % of all Items |
|---|---|---|
| WATER 23.7OZ STANFORD | 983 | 0.8% |
| NOTEBK 10.5x8 70SH 1SUB BLACK | 907 | 0.74% |
| NOTEBK 10.5x8 70SH 1SUB BLUE | 866 | 0.7% |
| BEVERAGE COFFEE/TEA | 752 | 0.61% |
| PEN/BIC CLIC 1C FS/WHITE | 739 | 0.6% |
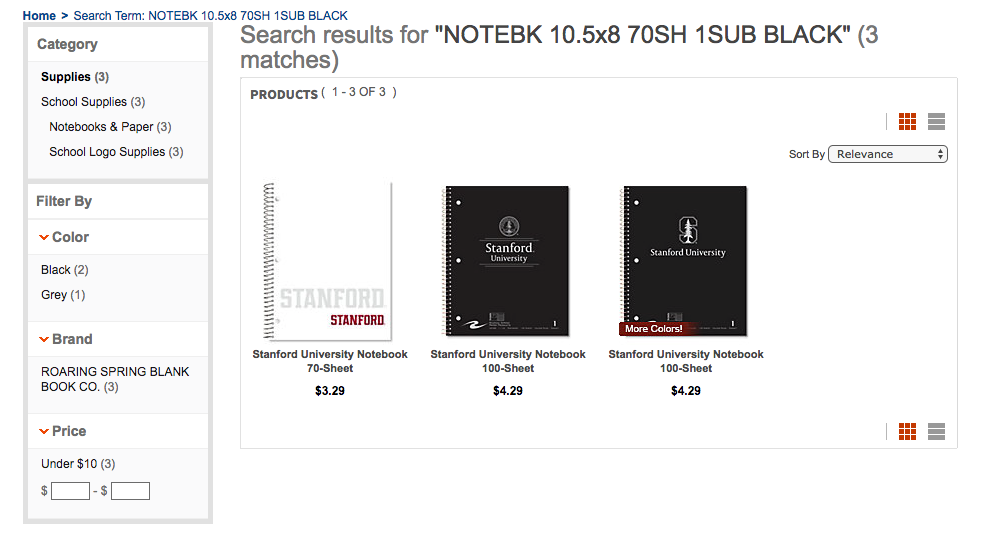
Instead, I decided to group the items into broader categories that would be easier to identify and would be more universely understood - and then had people rate these categories instead. The categorization process involved three steps. First, I created a list of all 12,977 unique items in the dataset and wrote a script that automatically searched the bookstore website for the associated item description and if a result was returned, parsed the first category on the results page (the first category referenced was the category that the modal number of search results belonged to). Overall, 8,647 items (65%) returned a search result. In the below example, the script would categorize purchases with an item_description equal to “NOTEBK 10.5x8 70SH 1SUB BLACK” to “Supplies”.
Next, using the categories from the bookstore website (Apparel & Accessories, Books, Food & Drink, Souvenirs, Supplies, and Technology), I had three research assistants manually go through all 12,977 unique items and for each item either 1) assign it to a category if a category did not currently exist, 2) check if the existing category was approproate, or 3) determine it to be unidentifiable (i.e. Unknown).
| Purchase Category | N | Freq |
|---|---|---|
| Apparel & Accessories | 37,735 | 30.69% |
| Books | 16,693 | 13.58% |
| Food & Drink | 11,906 | 9.68% |
| Souvenirs | 19,816 | 16.12% |
| Supplies | 31,811 | 25.88% |
| Technology | 3,152 | 2.56% |
| Unknown | 1,827 | 1.49% |
| Purchase Category | N | Freq |
|---|---|---|
| Apparel & Accessories | 4,587 | 35.35% |
| Books | 4,925 | 37.95% |
| Food & Drink | 423 | 3.26% |
| Souvenirs | 757 | 5.83% |
| Supplies | 1,604 | 12.36% |
| Technology | 497 | 3.83% |
| Unknown | 184 | 1.42% |
Finally, to allow for more heterogeneity within categories, I had each category wittled down to smaller, more specific subcategories. For each broad category, I created a list of subcategories and had research assistants once again go through each unique item and assign it to one of 58 total subcategories (e.g., for Books an item could be assigned to: “Textbooks”, “Childrens Book”, “General Fiction”, “DIY”, etc).
| Purchase Subcategory | N | Freq |
|---|---|---|
| Apparel | 32,115 | 26.52% |
| School Supply | 24,388 | 20.14% |
| Souveneir | 6,181 | 5.1% |
| Accessory | 5,361 | 4.43% |
| Non-Fiction Book | 4,620 | 3.81% |
| Glassware | 3,974 | 3.28% |
| Healthy Drink | 3,037 | 2.51% |
| Greeting Card | 2,594 | 2.14% |
| Textbook | 2,400 | 1.98% |
| General Fiction Book | 2,335 | 1.93% |
Pain/Guilt of Purchase
Simply grouping the purchased items into subcategories was not enough. While I had some of my own intuitions for how painful or guilty it would feel to buy an item from one category or another, I once again used crowdsourcing to get a more general perception. Since I assumed that the average bookstore consumer was either a student at the university or a member of the general public (i.e., a visitor), I collected perceptions of how painful and how guilty it would feel to purchase an item from a given subcategory from samples of 108 students from the university and 200 people on Amazon Mechanical Turk. In both samples, a given participant provided perceptions for a randomly selected 30 of the 58 subcategories, and rated each one on a scale of 1 to 7 (with 1 being the least pain/guilt and 7 being the most pain/guilt). The correlation of subcategory ratings for the separate samples was high (r = .79) so I combined the two samples into one.
| Purchase Subcategory | Pain/Guilt Score |
|---|---|
| Furniture | 4.64 |
| Tablet | 4.37 |
| Makeup | 4.29 |
| Computer | 4.23 |
| Sports Item | 4.20 |
| Toy | 4.17 |
| Glassware | 4.12 |
| Wearable Technology | 4.08 |
| Pet Item | 4.04 |
| Unhealthy Drink | 3.98 |
| Purchase Subcategory | Pain/Guilt Score |
|---|---|
| School Supply | 2.51 |
| Mint | 2.52 |
| Healthy Drink | 2.57 |
| Language Book | 2.58 |
| Literature Book | 2.60 |
| Office Supply | 2.61 |
| Non-Fiction Book | 2.71 |
| Coffee/Tea Drink | 2.85 |
| Reference Book | 2.86 |
| Cord | 2.89 |
| Greeting Card | 2.89 |
Once I collected these perceptions, I computed the average pain and average guilt for each subcategory and then averaged these two perceptions to get an overall score for how bad people would feel purchasing an item from each subcategory (pain/guilt score). I merged these scores in to the items data and additionally calculated the average pain/guilt score for each transaction - both a simple average (weighing each item in a given transcation equally) and a weighted average (weighing each item in a given transaction by the cost of the item). These transaction-level calculations were also merged into the data at the item level.
The final dataset (after removing all non-subcategorized items) contained a total of 118,042 purchased items and 42,660 transactions.
Analyses
Visualizing subcategory pain and cash usage
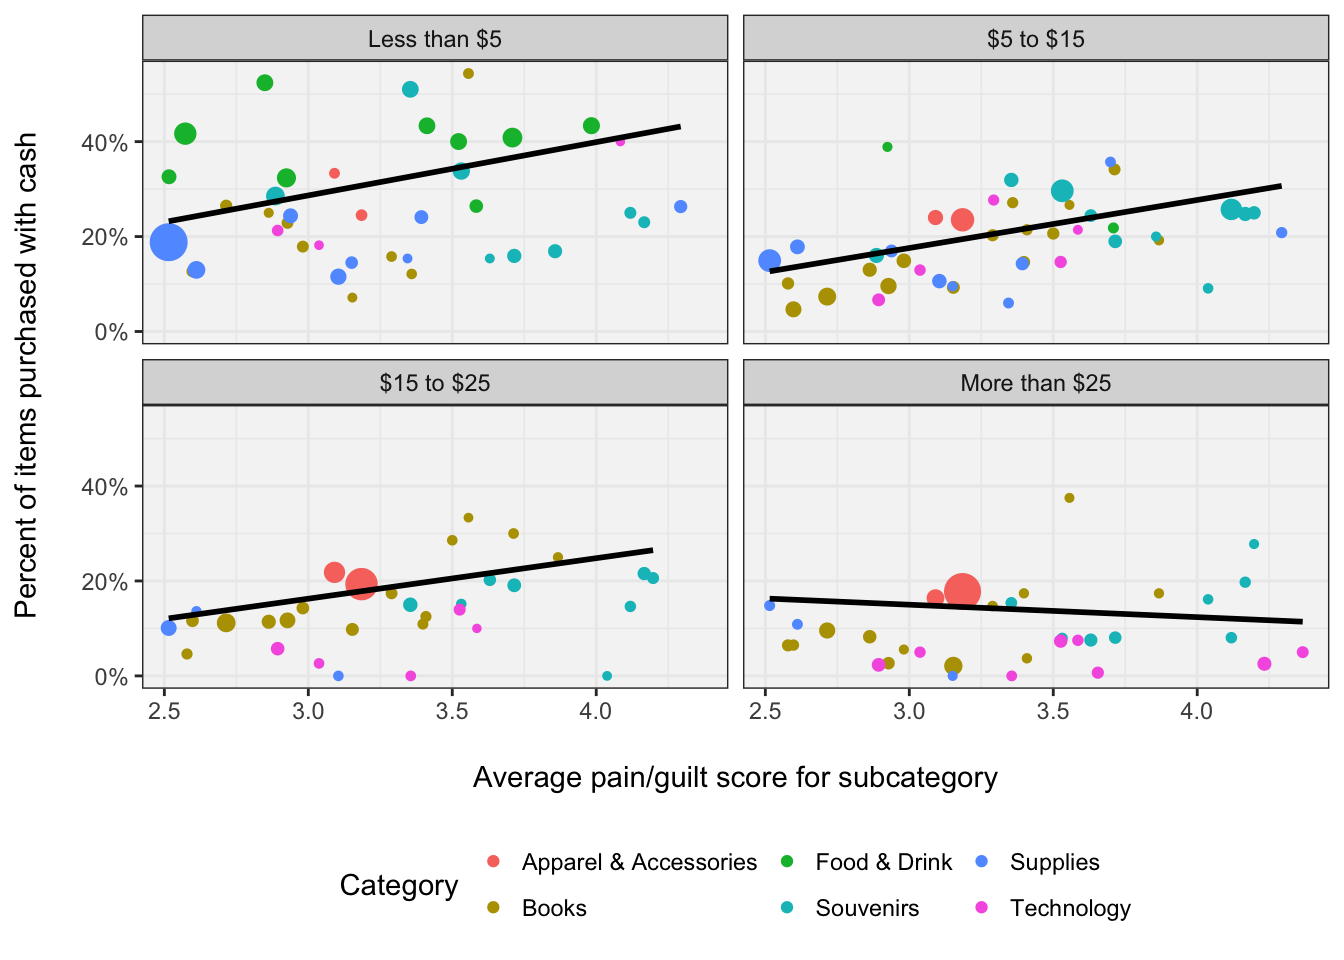
The key hypothesis to test is whether items with higher pain/guilt scores are more likely to be purchased using cash, controlling for all other factors. Before running any formal models, I wanted to visualize the relationship between cash usage and pain at the category level. Below, each data point is one of the 58 subcategories where the size of the point is scaled based on the number of items purchased in that subcategory. The x-axis the pain/guilt score for that subcategory and the y-axis is the percent of items purchased in that subcategory that were made with cash. I also split the data into four groups based on the cost of the item to somewhat control for item cost. Any subcategories with less than 10 purchased items at a given cost group were removed, as well as any items purchased in a transaction involving more than 10 items. The black line is the best fitting line - weighted by the number of purchased items in each subcategory.
Predicting cash usage from pain/guilt score of purchased items
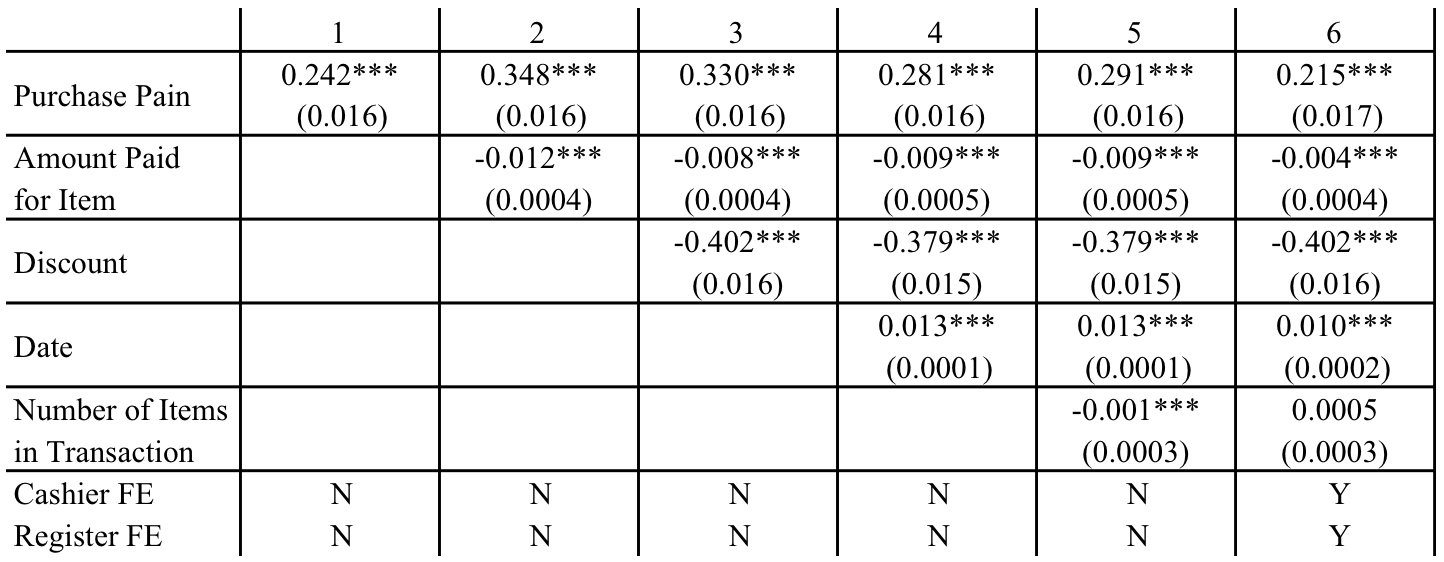
I ran several logistic regressions at the item-level with Cash (= 1) or Card (= 0) as the dependent variable and the pain/guilt score of the item as the key independent variable. In each model, I experimented with a variety of different random and fixed effect covariates - such as the register, the cashier, and the number of items purchased in the associated transaction - but always included the amount paid, the date, and the percent discounted off the item. Regardless of the covariates, the conclusion was very consistent: the higher the pain/guilt score, the more likely the item was to be purchased with cash.
A secondary measure of pain is the degree to which an item is discounted (where higher discounts are associated with less pain). Consistently, across all models, the higher the discount on the purchased item, the less likely the item was to be purchased with cash.
Predicting cash usage from (simple) average pain/guilt score of transactions
![]()
As a robustness check, I also performed similar logisitic regression models at the transaction-level. Once again, the dependent variable was always whether the transaction was made with cash, however, the independent variable was the average pain/guilt score of each item in the transaction. Once again, the higher the average pain/guilt score of the transaction, the more likely the transaction was to be made with cash.
Conclusions
Overall, the more guilt-inducing the transaction, the more likely consumers were to pay with cash. While this result is certainly consistent with my original hypothesis, it is important to note that these results are purely correlational and could be due to a selection issue. More specifically, it is possible that consumers who are more likely to buy more guilt-inducing items may also have a higher propensity to use cash for their purchases. To rule out this explanation, I ran a series of lab studies to more cleanly isolate the effect of purchase pain on cash usage. To see the methods and results of those studies, check out the paper linked at the top!